Marketing Reporting Chaos: Why More Dashboards Aren’t Fixing Decision-Making
“What actually changed this week, why did it happen, and what should we do about it?”

Marketing has never had more data.
Traffic.
Clicks.
Impressions.
Reach.
Engagement.
Conversion rates.
Cost per acquisition.
Pipeline.
Revenue.
Attribution.
Retention.
Search rankings.
Email performance.
Customer journeys.
Campaign ROI.
Share of voice.
Creative performance.
Every platform has a dashboard.
Every team has a report.
Every agency has another spreadsheet.
And somehow, when the CMO asks:
“What actually changed this week, why did it happen, and what should we do about it?”
the answer can still require three meetings and several analysts.
This is marketing reporting chaos.
Marketing reporting chaos occurs when data is spread across too many platforms, metrics and reporting processes for teams to quickly form a trusted view of performance and convert that information into decisions.
The problem is not a lack of reporting.
It is often too much reporting without enough intelligence.
And AI may fundamentally change that.
The future of marketing analytics is unlikely to be another dashboard containing more charts.
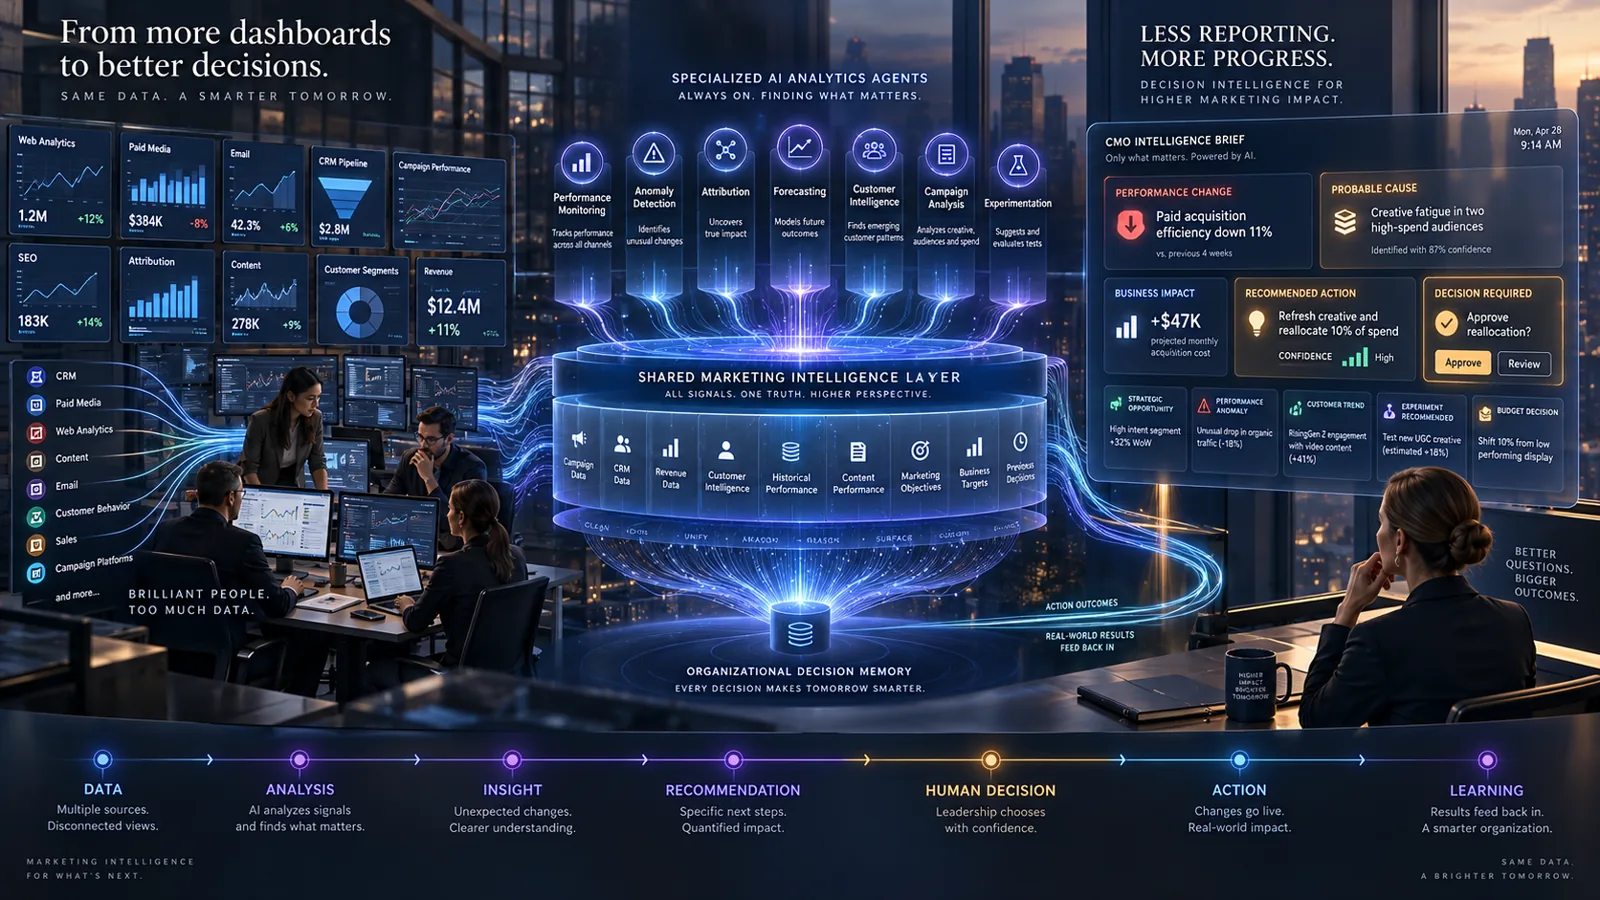
It is more likely to be a system that continuously monitors marketing performance, detects what matters, explains probable causes, recommends actions and escalates decisions that require human judgment.
In other words:
Marketing needs to move from reporting activity to decision intelligence.
How Marketing Reporting Became So Complicated
A modern marketing organization can generate data from:
CRM;
paid search;
paid social;
web analytics;
email;
marketing automation;
social media;
SEO;
ecommerce;
customer support;
sales conversations;
product analytics;
retail media;
content systems;
creative platforms;
customer data platforms;
and external market research.
Each system sees a different part of reality.
Google Ads may show clicks and conversions.
CRM may show pipeline.
Finance sees revenue.
Web analytics sees sessions.
Email software sees opens and clicks.
The social team sees engagement.
Sales has another view of lead quality.
Customer success may know whether the customers actually stayed.
None of those views is necessarily wrong.
But none independently represents the business.
That creates the first major reporting problem:
marketing data is fragmented by the systems used to generate it.
NIQ’s CMO Outlook for 2026 identified connecting data across sources as one of the largest barriers to achieving marketing’s data and insight potential. Only 37% of surveyed CMOs said they had a centralized data lake easily accessible to stakeholders.
The result is predictable.
Humans spend enormous amounts of time rebuilding a unified view manually.
The Reporting Workflow Nobody Talks About
Consider what happens before a weekly marketing report reaches leadership.
Someone exports advertising data.
Someone checks CRM numbers.
Someone updates the SEO report.
Someone pulls website analytics.
Someone receives social metrics.
Someone consolidates email performance.
Someone checks whether attribution changed.
Someone compares this week with last week.
Someone updates slides.
Someone formats charts.
Someone writes commentary.
Someone sends it for review.
Someone asks why the numbers differ from Finance.
Another person discovers a tracking issue.
The report is edited again.
Then the meeting begins.
A process that exists to support decision-making can itself consume significant operational capacity.
And there is an important distinction here:
Reporting work is not the same as analytical work.
Copying a number into a presentation is reporting work.
Understanding why the number changed is analytical work.
Deciding what the company should do because it changed is decision-making.
Many marketing teams spend too much capacity on the first stage and too little on the last.
Reporting Chaos Has Four Layers
Marketing reporting problems usually operate at four levels.
1. Data Chaos
The numbers are fragmented, inconsistent or difficult to access.
2. Metric Chaos
Different teams measure different things and optimize toward conflicting goals.
3. Dashboard Chaos
Even when data is technically centralized, leaders receive too much information to process efficiently.
4. Decision Chaos
The organization understands what happened but still cannot agree on what to do next.
Most companies try to solve all four problems by building another dashboard.
That rarely works.
More Dashboards Do Not Automatically Create More Clarity
Dashboards are useful.
They provide visibility.
They help teams monitor performance.
They can surface important signals quickly.
But dashboards also have a limitation:
they require humans to interpret them.
A dashboard can tell you:
Traffic fell 18%.
Conversion increased 7%.
Paid acquisition costs rose 13%.
Branded search increased.
Email revenue declined.
LinkedIn engagement doubled.
Fine.
What does that mean?
Is the traffic decline dangerous?
Was it expected?
Which segment drove it?
Did conversion improve because low-quality traffic disappeared?
Did CAC rise because media prices increased or creative performance declined?
Is branded search increasing because the campaign worked?
Should the company change budget allocation?
That is where reporting ends and intelligence begins.
Funnel’s 2026 Marketing Intelligence Report found that 72% of marketers surveyed said they had mountains of data but found turning it into insights challenging.
The problem is no longer access to numbers.
It is sense-making.
The Most Dangerous Dashboard Is the One That Looks Successful
Reporting also creates a subtler problem.
Metrics can look healthy without reflecting business impact.
Impressions rise.
Clicks rise.
MQLs rise.
Video views rise.
Engagement rises.
The dashboard is green.
Revenue remains flat.
This happens because marketing systems often optimize for the metrics they can observe most easily.
Platforms measure platform activity extremely well.
Businesses ultimately care about business outcomes.
The distance between those two creates what could be called the metric translation problem.
Marketing must continuously translate:
platform activity
into customer behavior;
customer behavior
into commercial impact;
commercial impact
into business strategy.
That becomes increasingly difficult as the number of channels expands.
This is one reason ROI measurement remains such an important CMO priority.
NIQ reported that 74% of surveyed CMOs were under greater scrutiny to prove marketing ROI, while the explosion of data was making it harder to integrate fragmented sources into a singular actionable view.
Attribution Makes Reporting Look More Certain Than It Is
Another source of reporting chaos is the expectation that every result can be attributed precisely.
A customer might:
see a LinkedIn post;
search the company weeks later;
read an article;
watch a webinar;
talk to sales;
return through Google;
receive three emails;
then convert.
Which channel created the sale?
The answer depends heavily on the measurement model.
First-touch attribution tells one story.
Last-touch attribution tells another.
Multi-touch attribution creates another interpretation.
Marketing mix modeling operates at a different level.
Incrementality testing asks a different question again.
Each technique can be useful.
None creates perfect omniscience.
IAB’s 2026 State of Data report notes that privacy regulation, signal loss, platform-embedded optimization and fragmented data environments have put increasing pressure on marketing measurement systems and made linking media exposure to outcomes more difficult.
This means marketing leaders need something dashboards rarely provide:
confidence levels and context.
A useful intelligence system should not simply say:
“Campaign X caused $2 million in revenue.”
It should be capable of saying:
“Campaign X likely contributed materially to revenue growth based on these signals, but attribution confidence is moderate because these customer journeys crossed multiple channels.”
That is a more honest—and more useful—form of intelligence.
Different Stakeholders Need Different Reporting
Another reason reporting becomes chaotic is that companies try to give everyone the same dashboard.
But the CMO, channel manager and CEO are solving different problems.
A paid-media manager may need:
CPM;
CTR;
CAC;
creative performance;
audience performance;
frequency;
budget pacing.
The CMO may need:
customer acquisition efficiency;
pipeline;
revenue contribution;
brand momentum;
retention;
channel allocation;
strategic risks.
The CEO may primarily need:
growth;
profitability;
marketing efficiency;
customer trends;
forecast implications.
When everyone receives every metric, information increases while clarity decreases.
Reporting should therefore be designed around decisions, not data availability.
The right question is not:
“What data can we show?”
It is:
“What decisions does this person need to make?”
What Is Marketing Decision Intelligence?
Marketing decision intelligence is the use of integrated data, analytics and AI to identify important changes in marketing performance, explain probable causes and recommend or execute appropriate actions.
This is different from traditional reporting.
Traditional reporting asks:
What happened?
Analytics asks:
Why did it happen?
Predictive analytics asks:
What is likely to happen?
Decision intelligence asks:
What should we do next?
That final question is where much of marketing value is created.
Forrester’s July 2026 research highlighted this exact gap. Although advanced measurement adoption is increasing, 49% of B2C marketing decision-makers still reported that analytics findings do not translate into action. Forrester argues that generative and agentic AI can shorten the distance between insight and execution.
The Future Report May Not Be a Report
Imagine opening your marketing system on Monday morning.
Instead of 14 dashboards, you see:
1. Paid Acquisition Efficiency Declined 11%
Probable cause: Creative fatigue in two highest-spend audiences.
Evidence: CTR down 18%; frequency increased; landing-page conversion unchanged.
Impact: Estimated additional acquisition cost of $47,000 this month if the trend continues.
Recommended action: Rotate creative in these two audience groups and shift 10% of spend temporarily to Campaign B.
Decision: Human approval required.
2. Organic Search Opportunity Detected
Three high-intent query clusters increased significantly in the past month.
Existing company content ranks between positions 5 and 12.
Recommended action: Refresh four existing articles rather than produce new content.
3. Pipeline Quality Improved
Lead volume declined 9%.
Sales-qualified conversion increased 21%.
Revenue forecast remains ahead of target.
Recommendation: Do not optimize toward recovering raw lead volume.
That is not really a dashboard.
It is a decision interface.
The system does not merely display the underlying data.
It interprets it before it reaches leadership.
From Dashboard Monitoring to Continuous AI Monitoring
Humans are not particularly well suited to continuously inspect hundreds of metrics.
AI systems are.
An analytics agent could continuously monitor:
traffic;
campaign performance;
pipeline;
conversion;
creative performance;
customer behavior;
content performance;
SEO;
email;
retention;
competitor activity;
and budget pacing.
Most of the time, nothing significant happens.
The system does not need to alert anyone.
When a meaningful deviation occurs, it can investigate.
This changes the model from:
Humans continuously inspect dashboards looking for problems
to:
AI continuously monitors systems and surfaces meaningful exceptions.
This is potentially a major shift in marketing operations.
Forrester specifically describes AI systems flagging anomalies, performance spikes, risks and opportunities while they are still actionable, then translating measurement into recommended tactics with human oversight.
The AI Analytics Agent
Within an AI-native marketing organization, analytics may increasingly become a specialized agent capability.
An Analytics Agent could be responsible for:
monitoring approved data sources;
comparing current performance with historical baselines;
detecting anomalies;
investigating probable causes;
connecting campaign activity with business outcomes;
identifying opportunities;
forecasting implications;
recommending experiments;
and escalating important decisions.
But this only works if the underlying data foundation is reliable.
AI does not magically repair poor measurement.
Feed an intelligent system inconsistent campaign naming, missing CRM fields, broken tracking and contradictory definitions and you may get a more eloquent explanation of bad data.
That is why AI analytics requires:
clean data;
consistent definitions;
governance;
access controls;
reliable integrations;
and organizational agreement on business metrics.
AI can accelerate intelligence.
It cannot eliminate the need for measurement discipline.
The Reporting Stack Needs a Shared Semantic Layer
There is another architectural requirement.
Different systems frequently define the same concept differently.
What is a “customer”?
What counts as a “lead”?
What is “revenue”?
Which conversion date matters?
What is “marketing sourced”?
What does “active user” mean?
If every dashboard answers those questions differently, AI will inherit the ambiguity.
A mature marketing intelligence architecture therefore needs a shared semantic layer.
In simple terms:
the organization needs agreed definitions of what its numbers mean.
This layer might define:
core business metrics;
customer lifecycle stages;
campaign naming;
channel taxonomy;
attribution definitions;
financial measures;
conversion events;
time periods;
and data ownership.
Without semantic consistency, centralizing data does not necessarily create a single source of truth.
It may simply centralize disagreement.
Five Levels of Marketing Reporting Maturity
A useful way to think about the evolution is as five levels.
Level 1: Manual Reporting
Teams export data and assemble spreadsheets or slides manually.
The main question is:
What happened?
Level 2: Dashboard Reporting
Data is connected into dashboards.
Teams receive faster visibility.
The question remains:
What happened?
Level 3: Diagnostic Analytics
Analysts investigate changes and determine probable causes.
The question becomes:
Why did it happen?
Level 4: Predictive Intelligence
Models forecast performance and detect emerging trends.
The question becomes:
What is likely to happen next?
Level 5: Decision Intelligence
AI continuously monitors performance, identifies material changes, explains probable causes, estimates impact and recommends action.
The question becomes:
What should we do?
The progression is not about eliminating dashboards.
It is about moving dashboards deeper into the infrastructure.
Leadership should increasingly interact with the conclusions, not every underlying chart.
Reporting Should Become Exception-Based
Most executive reporting should not require leadership to inspect everything that is working normally.
If email conversion is within expectations, why does the CMO need three charts about it?
If campaign pacing is on target, why discuss it?
If website performance is stable, why spend five minutes reporting that nothing changed?
An intelligent system should operate on exceptions.
Show me:
what materially changed;
what is unexpectedly underperforming;
what is unexpectedly outperforming;
what requires a decision;
what creates a risk;
what creates an opportunity;
and what needs further investigation.
Everything else can remain accessible underneath.
This dramatically reduces cognitive load.
Instead of asking a leader to discover the signal within the noise, the system surfaces the signal.
Reporting Meetings Should Change Too
A weekly reporting meeting often sounds like this:
“Traffic increased 6%.”
“Email open rates decreased.”
“LinkedIn performed well.”
“We generated 147 leads.”
“Paid search CAC was slightly higher.”
That is not a decision meeting.
It is people reading dashboards to one another.
A stronger meeting starts with:
Decision 1: Should we increase investment in this channel?
Decision 2: Should we stop this campaign?
Decision 3: Which audience deserves the next experiment?
Decision 4: Is declining lead volume acceptable given rising quality?
Decision 5: Do we need to change the quarterly forecast?
Data supports the conversation.
It is not the conversation.
How to Fix Marketing Reporting Chaos
Companies do not need to leap immediately into autonomous AI analytics.
Start with the fundamentals.
1. Decide Which Business Outcomes Matter
Before building reports, define the business questions.
Revenue?
Pipeline?
Retention?
Acquisition efficiency?
Brand?
Customer lifetime value?
Market share?
Different businesses require different answers.
2. Define Metric Ownership
Every critical metric should have:
a definition;
a data source;
an owner;
a refresh frequency;
and known limitations.
3. Reduce Dashboard Duplication
Identify which reports are actually used.
Retire dashboards nobody looks at.
Combine overlapping views.
Do not measure reporting maturity by the number of charts available.
4. Separate Operational and Executive Reporting
Operators need detail.
Executives need decisions.
Design each interface accordingly.
5. Connect Marketing Data With Business Data
Marketing performance cannot be evaluated exclusively within marketing platforms.
Connect campaign activity with:
CRM;
revenue;
customer behavior;
retention;
and business outcomes.
6. Introduce Automated Anomaly Detection
Before implementing sophisticated agentic workflows, begin with systems that identify statistically or operationally meaningful deviations.
7. Add AI Interpretation Carefully
Once data is trustworthy, AI can summarize changes, identify relationships and recommend areas for investigation.
8. Add Human-Governed Actions
For high-impact actions such as major budget changes, pricing, customer communication or strategic shifts, humans should retain appropriate approval.
What Should a CMO Actually See?
If the future CMO interface is not 20 dashboards, what should it show?
Probably a limited number of high-value intelligence cards.
For example:
WHAT CHANGED
Paid acquisition efficiency declined 9%.
WHY
Decline is concentrated in three creative sets that have been active for six weeks.
BUSINESS IMPACT
Projected additional quarterly acquisition cost: $180,000.
RECOMMENDED ACTION
Refresh creative and shift 15% of spend temporarily to unaffected campaigns.
CONFIDENCE
High.
DECISION
Approve budget reallocation?
This is radically different from a chart showing CAC over time.
The underlying chart still exists.
But AI interprets it before leadership receives it.
Not Every Decision Should Be Automated
There is an understandable temptation to jump from reporting automation to autonomous marketing.
That needs caution.
A system may be able to detect that a campaign is underperforming.
Automatically pausing it could be appropriate if:
the rule is low risk;
the impact is limited;
the threshold is well defined;
and the action is reversible.
A system proposing a $5 million budget reallocation is different.
The greater the:
financial impact;
brand impact;
customer impact;
legal risk;
or strategic importance,
the more likely human approval should remain involved.
The future is therefore not:
AI sees data → AI changes everything.
It is more likely:
AI monitors → AI explains → AI recommends → human approves where necessary → system executes.
Reporting Becomes a Learning System
The biggest opportunity goes beyond faster reporting.
Imagine every decision being captured.
The system notices campaign performance dropped.
AI recommends a creative change.
The CMO approves it.
Performance improves.
That outcome becomes part of organizational memory.
Next time similar conditions appear, the system knows:
what happened previously;
what decision was made;
and what outcome followed.
Marketing analytics then becomes cumulative.
The organization does not simply collect more data.
It builds decision memory.
That may ultimately become more valuable than any individual dashboard.
Frequently asked questions
What is marketing reporting chaos?
Marketing reporting chaos occurs when marketing data, metrics and reporting processes are fragmented across too many systems, making it difficult for teams to develop a trusted view of performance and convert data into timely decisions.
Why is marketing reporting so complicated?
Modern marketing operates across many channels and platforms, each with different metrics and measurement models. Data silos, inconsistent definitions, attribution complexity and different stakeholder requirements make unified reporting difficult.
Are marketing dashboards still useful?
Yes. Dashboards remain useful for operational monitoring and detailed analysis. However, executives increasingly need summarized intelligence that explains what changed, why it matters and what action should be considered.
How can AI improve marketing reporting?
AI can monitor large volumes of performance data, detect anomalies, summarize changes, investigate probable causes, forecast potential impact and recommend actions. AI works best when underlying data is clean, integrated and governed.
What is marketing decision intelligence?
Marketing decision intelligence combines integrated data, analytics and AI to move beyond reporting what happened toward explaining why it happened, predicting what may happen next and recommending appropriate action.
What should a CMO marketing dashboard include?
A CMO-level reporting interface should prioritize business outcomes, material performance changes, ROI, customer trends, major risks, opportunities, forecasts and decisions requiring executive attention rather than displaying every operational metric.
Will AI replace marketing analysts?
AI is likely to automate more data collection, reporting, anomaly detection and basic interpretation. Analysts can therefore spend more time on measurement strategy, experimentation, causal analysis, business interpretation and high-value decision support.